As an engineer-manager in manufacturing you have been exposed to the concepts of Industry 4.0. You are now aware of the huge benefits that data from connected machines can bring for you and your customers. You have now decided to get started with an IoT project to see for yourself.
All IoT solutions are basically data analytics solutions. However much we may get excited about sensor technologies, edge computing, data communication protocols and cloud platforms, in the end it is the meaning that you make from the data is what is going to drive value.
To make meaning from the data you need to analyse it. So, ideally even before you jump into a full scale IoT POC project think about doing an analytics project if you have collected data with regard to the problem you are trying to solve.
That said, it is important to understand that there are some fundamentals that you need to get right if you are to increase the success rate of your analytics projects. (Yes, there is no guarantee that all projects will be successful!)
Let’s look at some of the most important factors that will help you to succeed.
Do not pick a project because it looks like a good thing to do or gets you excited because it seems to be an interesting problem to solve. Use techniques such as the Pareto Analysis (‘vital few, trivial many’ rule) to identify the problem that is a good candidate for solving.
It may not, however, be necessary that the highest occurring problems are the best candidates. Use other criteria such as impact on your customer delight and/or ROI. Factors such as your budget or your objective to strike quick gains by selecting the low hanging fruit can also play an important part in selecting the project.
All things being almost the same, I recommend that you pick the project that can have the most beneficial effect on your customer.
In short, do a data-based analysis based on your historical data and potential gains before you zero in on your first data analytics project. Ironical, isn’t it!
We see people choosing a project and then diving directly on what they would like to analyse. They are ready to create a nice table of all the measurements that they would like to capture. But first things first. Once you have decided on which problem to solve, be clear of what your goals are. Are you trying to reduce scrap, increase efficiency, reduce cost or improve reliability?
Depending on your goals your measurement parameters will also vary. The key is coming up with the right KPIs for improvement. This was discussed in an earlier article. Note that the KPIs are often output parameters and dependent on one or more input parameters that need to be measured. So, once KPIs are determined, expert knowledge need to be used to decide what input parameters for the KPIs are to be measured and captured.
For example, as a maintenance engineer your goal maybe to increase the mean time to failure (MTTR) of your motors by 20%. MTTR is your KPI and 20% increase is your targeted goal. Instead of routine preventive maintenance you would now want to use predictive maintenance to ensure this goal, because you know that this is likely to be more effective.
Now, what are the input parameters for which you would like to collect data? Your expertise and experience may suggest parameters such as vibration, power surges, temperature, bearing wear and so on as the required parameters to be measured to predict failure and thereby increase the MTTR. Missing out on selecting the right parameters or selecting the wrong ones can result in poor outcomes, loss of valuable time and also confidence.
Ideally, your team should include the process expert, the process data analyst, the data analytics expert and the information technology expert. Depending on the size and complexity of the problem there could be more than one person for each of the roles.
The process expert in the above motor related example is the maintenance engineer with experience in maintaining motors.
The job of the process data analyst is to ask the right questions and ensure that the inputs from the process experts are converted into meaningful decisions on what to measure and what to leave out, the frequency and method of measurement and so on. This person has a reasonable amount of knowledge of the process (in this case the maintenance of motors) and at the same time has a data oriented background – e.g. a background in statistical techniques or SPC. Note that a process expert with a background in using statistical techniques can also double up as a process data analyst.
The data analytics expert (or as some would call the data scientist) is responsible for all the activities that are necessary to give you the desired information from the collected data. At the end of the day all you need is actionable information based on which you can make decisions.
The job of the data scientist is to allow to you do that without you knowing how he/she does it, which can be quite complicated. This expert is trained to identify the right statistical tools to analyse the data, to run tests against hypotheses, use techniques such as modelling, clustering and decision trees, identify patterns and draw conclusions. To help with the process he/she uses appropriate data analytics software, since it is virtually impossible to do all of this manually.
Finally, your IT expert is the one who helps you with the right hardware, network and software infrastructure to support the data analytics process.
Without the requisite expertise for each of the above roles a data analytics project can be doomed right from the beginning.
The general assumption is that you need to have a huge amount of data to draw the correct conclusions. This train of thought can actually become a roadblock to even getting started. (“We do not have enough data and it is difficult to generate enough data within such a short period”.)
Now, how ‘enough’ is good enough? Actually, it depends. But you really do not need tons and tons of data to get started with. Even as low as 20-30 data points for each parameter can be good to start with. I would imagine that it is not difficult to generate 3 to 4 times more than that in real working condition. The data analyst is of course the right person to consult on this. Bottom line: do not use insufficiency of data as a reason to not get started.
The quality of data is, of course, a very important factor. The old adage ‘garbage in garbage out’ is applicable here as well. The process data analyst and the data scientist can help you identify the pitfalls of collecting quality data and how to go about ensuring data quality. As an example, when you collect data you have to eliminate bias caused by say an abnormal running condition which may be interpreted as normal. Or, as in the case of manual measurements, there can be a measuring operator bias. Or there could be a problem with measuring instrument or gauge. Using the right statistical tools your data scientist should be able to help you to avoid data quality problems.
Do not wait until the end of the project to find out that you have not obtained the correct results. Data analytics can be tricky. In spite of all the initial planning and study of the requirements, the method selected to arrive at the conclusions can be wrong. You may have chosen an incorrect technique or a wrong data model or may not have defined the criteria such as accuracy or precision correctly. In some cases, the data model may be good but it needs to be adjusted in terms of what is acceptable data and what is not acceptable.
To avoid this problem, you need to consider the outputs of the analytics model periodically as it goes about analyzing your data and spewing out the results to ensure that you are on the right track. Periodical sampling of the results will help you to course-correct early on. This will ensure a higher chance of success in the end.
You may have a separate list of factors that influence the success of a data analytics project. I will be happy to learn from you. Please share your valuable inputs in the comments box below.
We understood how to predict an anomaly in a specific measurement parameter such as temperature in the last article by using control charting technique.
Another important technique to predict an outcome is the regression analysis. A regression analysis is used to predict the value of a dependent variable (say cutting tool life) on an independent variable on which the dependent variable depends (say the cutting speed).
Now, before you do a regression analysis you must have some idea or suspicion about the dependency of the dependent variable on the independent variable. For example, machinists may suspect based on their experience that higher cutting speeds may lead to lowering of tool life. Therefore, the first objective of doing a regression analysis is to confirm if this could be true.
Creating the scatter diagram
Here is a table of readings based on an experiment on life (in minutes) of a cutting tool with three different cutting speeds (meters/min). Life was measured for four tools for each level of speed to ensure we have a reasonable sample size at each speed.

To find some meaning out of this data it is important to plot the tool life (Y) against the cutting speed values (X). Note that Y is the dependent variable and X the independent variable that Y is suspected to be dependent upon. The plot is called a scatter diagram and is shown as below.

It is quite evident from the plot that as speed increases the life in minutes reduces from a high of 30’s to 40’s to 5’s to 15’s. So, the machinist’s suspicion appears to be correct. Thus, the first objective of confirming the suspicion through this analysis has been met.
Now, the second objective of doing regression analysis is to be able to predict the dependent variable Y – in this case tool life - by measuring the independent variable X, which is the cutting speed. This exercise is necessary since it is not possible to plot all the potential points in a graph like this for all the real-life situations.
To do this you will need to ‘fit’ a regression line that best suits the scatter plot. You can do this using Excel by plotting the trend line as in the chart below. (Other statistical software tools can also be used. If you love statistics you can also do this manually by using the Least Squares method.)

Excel also allows you to find the equation of the line as represented by the formula y = -5.6594x + 194.38
This shows a linear relationship between tool life and cutting speed and the negative slope indicates that as speed increases life decreases. The value of Y is 194.38 minutes if X is zero. This essentially means that if the tool were to stay static but in touch with the component that it was to cut it would last these many minutes!
Based on this equation you can now predict the life of the tool for say a cutting speed of 35 meters/min. An important point to note here is that this prediction is not a certainty. Additional statistical analysis however can show with what probability percentage (say 95% or 99%) the life will lie between two values – but let’s not complicate this for now!
Let’s instead look for a few more example use cases. For example, you may want to find the effect of temperature on viscosity of oil and predict the viscosity. Or tire life based on distance travelled. Or level of contaminants in lube oil on wear of bearings. And predict potential failure based on the regression model you come up with.
How can this help you with your IoT solution? As an example, you can capture the independent variable data (X – e.g. distance travelled) real-time. You can then use the analytics engine to predict the value of the dependent variable (Y – e.g. tire life). You can then set your rules engine to send an alert if the analytics engine predicts with say 95% probability that the tire will fail within the next 100 KM.
In the above examples, we have considered only one independent variable to be impacting the response variable. However, in many cases there could be multiple independent variables influencing the outcome of the response variable. For instance, tire life can be dependent upon distance traveled and also average roughness or bumpiness of the road traveled. In such a case the multiple linear regression is used.
Additionally, not all regression analysis is linear. In such cases non-linear curve fits and equations have to be arrived at.
And finally, you need to be cautious about deciding that the independent variable is indeed the cause of the value of the dependent or response variable. Here you need to use experience and judgment. A good example is that generally weight of people has a linear relationship with their height. But increasing the weight of a person does not increase his height!
If you have read my previous article you may be able to answer the following: why do you think that there is more than one reading (actually 4 for each of the 4 tools used) for the cutting tool life for each level of cutting tool speed? What is the statistical distribution these points are likely to follow? Write your answers in the comment box!
To learn more about such topics click on the button below and fill a small inquiry form and we shall get in touch.
Last time I wrote that data collected from connected machines and stored can support predictive maintenance and add valuable inputs for you to improve your product design.
However, it is good to have a basic understanding of how this works and one need not be a statistician to know the basic concepts. Today we will see how control charting technique can be used to create a model to control a single characteristic like temperature which is not dependent on any other factor. In a later article we will find out how to predict a value of one factor by measuring another factor on which it is dependent upon.
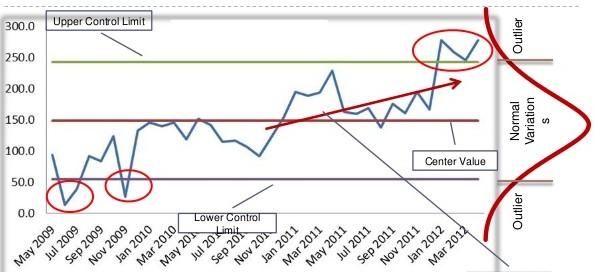
Say, the temperature of a refrigerated truck carrying medicines is required to between 15⁰C and 20⁰C, with a tolerance band of 5⁰C and mean of 17.5⁰C. This means that you would not want the temperature to cross the upper and the lower limits consistently.
Usually, such a time series data follow something called a normal distribution in statistics and is represented by the famed bell-shaped curve. In such a case, there is a process control technique called the control chart which allows you to calculate the upper and lower control limits of the temperature based on the variation in the process. If the temperature control system is good, meaning the variation is less, the upper and the lower control limits will actually be within the specified limits of 15⁰ and 20⁰ centigrade thus narrowing the band from 5⁰C to say 4⁰C.
Based on these control limits you may now set your analytics program to alert you based on certain rules so that you may ensure the regulation of the temperature back to the specified range if an anomaly occurs. A rule can say that as soon as the recorded temperature breaches the upper or the lower control limit an alert is generated (stringent rule). Or it may say that, generate alert only if three consecutive readings breach a limit (less stringent rule).
A rule may also be set that if more than, say, five consecutive readings are above or below the mean line (17.5⁰C) an alert is sent, even though the values are within the control limits. The interpretation is that since the mean has shifted there is a likelihood of the temperature breaching the upper or lower limit depending on which side the mean has shifted.
Similarly, there is the trend rule, where, if several readings display a trend that the temperature is moving upwards or downwards an alert be generated, even though the values maybe within the control limits. Here also the interpretation is that since the temperature is moving upwards or downwards it is likely that it will breach the limits.

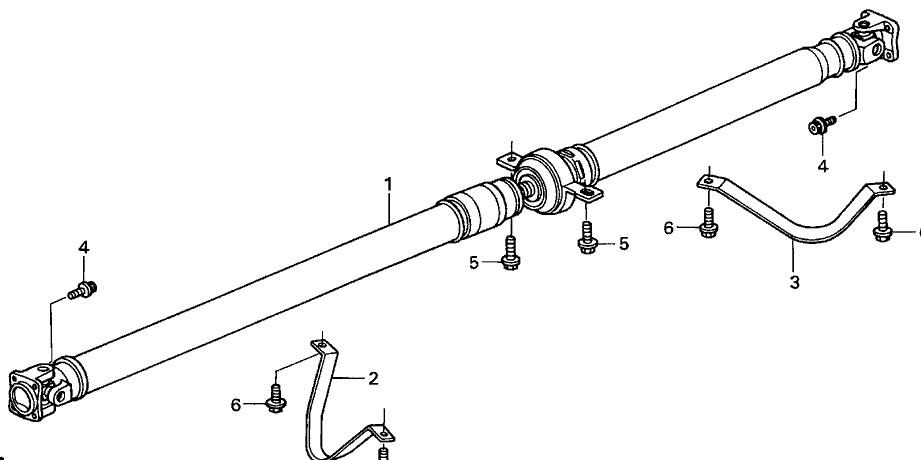
As companies start thinking about connecting their machines to other machines and larger systems (read IoT!) they are probably focusing more on almost real-time decision making and autonomous action. However, there is also a huge goldmine that lies in the data that gets captured and stored by them and that can help them to better their product design and gain that extra competitive edge. Consider a commercial vehicle propeller shaft manufacturer who wants to study the stresses and strains that the spline and universal joints undergo in real life situation to predict the failure of these joints.
Now, this is a common use case – universally known as predictive maintenance and touted rightly as one of the big benefits of IoT. Based on data collected, patterns can be detected and with help of algorithms a fairly accurate prediction of when failure may happen can be made by the system and an alarm raised for repair/replacement.
But, the utility of the data does not end there. Once you have long term failure data that correlates with data such as road/terrain condition, time of the year, geographical location, driver behavior, preventive maintenance history and so on, you have critical design inputs on how to improve the design of the shaft joints so that reliability improves, mean time to failure (MTTF) increases and thereby provide better value to the vehicle owner. Perhaps, eventually you may customize the design based on end use conditions to derive more value.
And now imagine what can happen when you obtain the same sort of data from your competitor’s product? Nothing prevents you from studying their product in the market in the same way. You then have a rich picture of how your product fares against theirs and why.
All of this assumes two things: that you have the necessary IoT system incorporated in your product and system design; and that you start with the objective in mind of gathering data for design improvement and value engineering purposes.
To gain, as I said, that extra edge. Just do it, before your competition does!

The unfortunate sacking of an employee in a well-known IT services company went viral in the social media last week and brought to the forefront some serious issues with regard to employment conditions, ethics and, more importantly, how one treats people.
However, a deeper issue from the point of view of the IT employees and the thousands of students joining the workforce every year, is the issue of possessing the critical and relevant skills that will be absolutely necessary in the digital age.
I do not mention ‘digital age’ in the context of something we are foreseeing to be happening sooner or later in the future. I mention it in the context of something that is HERE and NOW!!
It is clear that the ‘successful’ companies are not ready to take advantage of the digital age and they are going to face increasing difficulties because of this. They are definitely not equipped to re-train in large numbers the employees that they have. Firings are therefore an inevitable corollary.
I am also not sure about the proportion of employees that are capable to getting trained in new skills. And the ability of the educational institutions to support students to learn these skills is doubtful. Much has already been said about the quality of the institutions and their outcomes for so many years.
So where does this leave the students and the employees? My suggestion: take responsibility of your life yourself; do not expect your employers or your colleges to help you.
And there are plenty of opportunities opening up in the areas of Internet of Things (IoT), Virtual Reality, Cognitive Computing, AI, Robotics – all a part of the digital economy that we are talking about.
Take IoT for instance: it requires a variety of skills. Get yourself trained in any of these that suit your liking and strengths.
Let me give you some pointers: IoT requires sensor technologists to identify the right sensors for the required solution. Or even design new sensors for new and existing applications. It requires experts in microcontrollers and microcomputers design and embedded software specialists that write code that gets installed in these.
It requires communications engineers who can ensure that sensor data travels efficiently to data servers. It requires statisticians who are good at running experiments and coming up with data models for doing run-time analytics. It requires Big Data and Business Intelligence experts who help handle large amount of data and make meaning out of it.
It requires UX/UI developers to develop front end solutions for information visualizations. It requires IoT platform software developers who can write programs on these platforms. It also requires experts in cloud server management. It surely, surely needs cybersecurity specialists who are experts in IoT security infrastructure.
I am sure some of the readers will be able to come up with several other required skill sets. The point I am trying to make is that most of these expertise lie in the allied domains of experienced employees. All they need to do is to take some courses; but more importantly get some hands-on experience in their chosen field. The last is a MUST. Without getting one’s hands dirty, one will not gain the requisite experience to be considered an expert.
There are many small companies and start-ups who one can get in touch with and who will be happy to accommodate someone with the zeal to learn and in return help the company in some way. For the students, I have the same suggestion – go out there and get your hands on to real work.
And be prepared to follow the dictum – ‘learn before you earn’!
Designed by W3Squad